Among Leading Canadian Hedge Funds
BT Global Growth Fund (the “Fund”) is a Canadian based, globally oriented long-short fund. We believe that long-short “value” investing provides compelling risk adjusted returns. We aim to take advantage of the resource heavy Canadian stock markets to benefit from global growth, to take advantage of inefficient and less competitive environments and to increase the “hard asset” weighting of your portfolio. In the Canadian Hedge Fund market, there are few established leaders despite many choices. In November 2022, the Fund was recognized as the second best Canadian Hedge Fund for over 5 years. We make this choice simple. Co-invest with experienced finance experts in a smaller fund to better exploit investment opportunities and grow your capital.
Investment Strategy
The Fund has a strict focus on growth with downside protection. The Fund generates superior money-making ideas by purchasing stocks trading at low cash flow values, offering a “margin of safety”. Although we are among the leading Canadian Hedge Funds, it is our opinion that many of the best growth opportunities can be found when the assets are outside of Canada, yet the equities are listed on Canadian exchanges. We believe that we are well positioned to take advantage of these opportunities as our management team has extensive international business experience.
Our long positions are complemented by judicious shorting of industries and stocks poised to suffer from global economic themes. We use minimal leverage in our Fund and focus on disciplined trading to reduce investment risk.
Many managers of Canadian Hedge Funds do not invest their personal capital alongside their investors. We strongly believe in aligning our interests with the interests of our investors and as such, our partners invest a majority of their own investible wealth in the Fund.
Management Team
BT Global Growth is managed by Paul Beattie and Jacques Lacroix, the original founders. To find more about the management team visit the company’s corporate profile.
Fund Summary & Terms
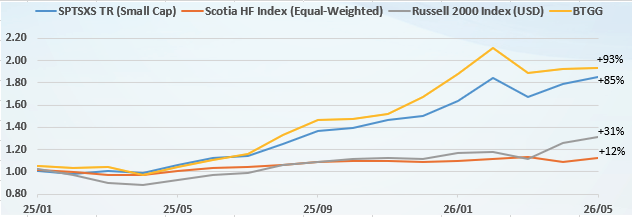
Compare Our Fund’s Performance*
Monthly performance*
Net Asset Value per Unit (NAV)*
Performance Report
Sign up to BT Global Growth Newsletter and receive performance reports as well as our market analysis!

*The Fund investment strategy is to generate above market returns while controlling risk through diversification among asset classes, sectors, market capitalizations and value analysis. The Fund may consist among other instruments: short positions, exchange-traded funds, commodities, equities and warrants, convertible, non-tradeable or restricted securities, and bonds. Please refer to the Fund’s Offering Memorandum. All performance figures are net of all fees and expenses. Past performance and pro forma returns are not necessarily indicative of future returns. Market indices returns are used for information purposes only. The market indices referred to are broad-based and capitalization-weighted and, as such, differ materially from the Fund portfolio composition, strategies and management style and are therefore of limited use for comparing risks and returns performance of the Fund or other actively managed funds. The information contained herein, including market indices returns, while obtained from sources which we believe to be reliable, is not guaranteed as to accuracy or completeness, no representation is being made to that effect, may not and should not be reproduced or used for any other purpose. This document is for information purposes only and does not constitute an offer to sell or a solicitation to buy units of the Fund or the securities referred to herein. Please check with your financial advisor before making any investment decisions.
The S&P/TSX Indices are products of S&P Dow Jones Indices LLC (“SPDJI”) and TSX Inc. (“TSX”). Standard & Poor’s® and S&P® are registered trademarks of S&P Global, Inc. or its affiliates (“S&P”); Dow Jones® is a registered trademark of Dow Jones Trademark Holdings LLC (“Dow Jones”); and TSX® is a registered trademark of TSX. SPDJI, Dow Jones, S&P and TSX do not sponsor, endorse, sell or promote any products based on the Indices and none of such parties make any representation regarding the advisability of investing in such product(s) nor do they have any liability for any errors, omissions or interruptions of the Indices or any data related thereto.
The Fund results and NAV are calculated on a monthly basis by the administrator, The Investment Administration Solution Inc. Results are for the BT Global Growth Fund as a whole, after considering all fees and not for one particular class of units.